

Lifting the Lid on Copilot's Black Box: Observability for LLM Code Generation

Search for a command to run...
No comments yet. Be the first to comment.
Following the Trail from the Cultura & FFT Breaches to SendGrid Abuse

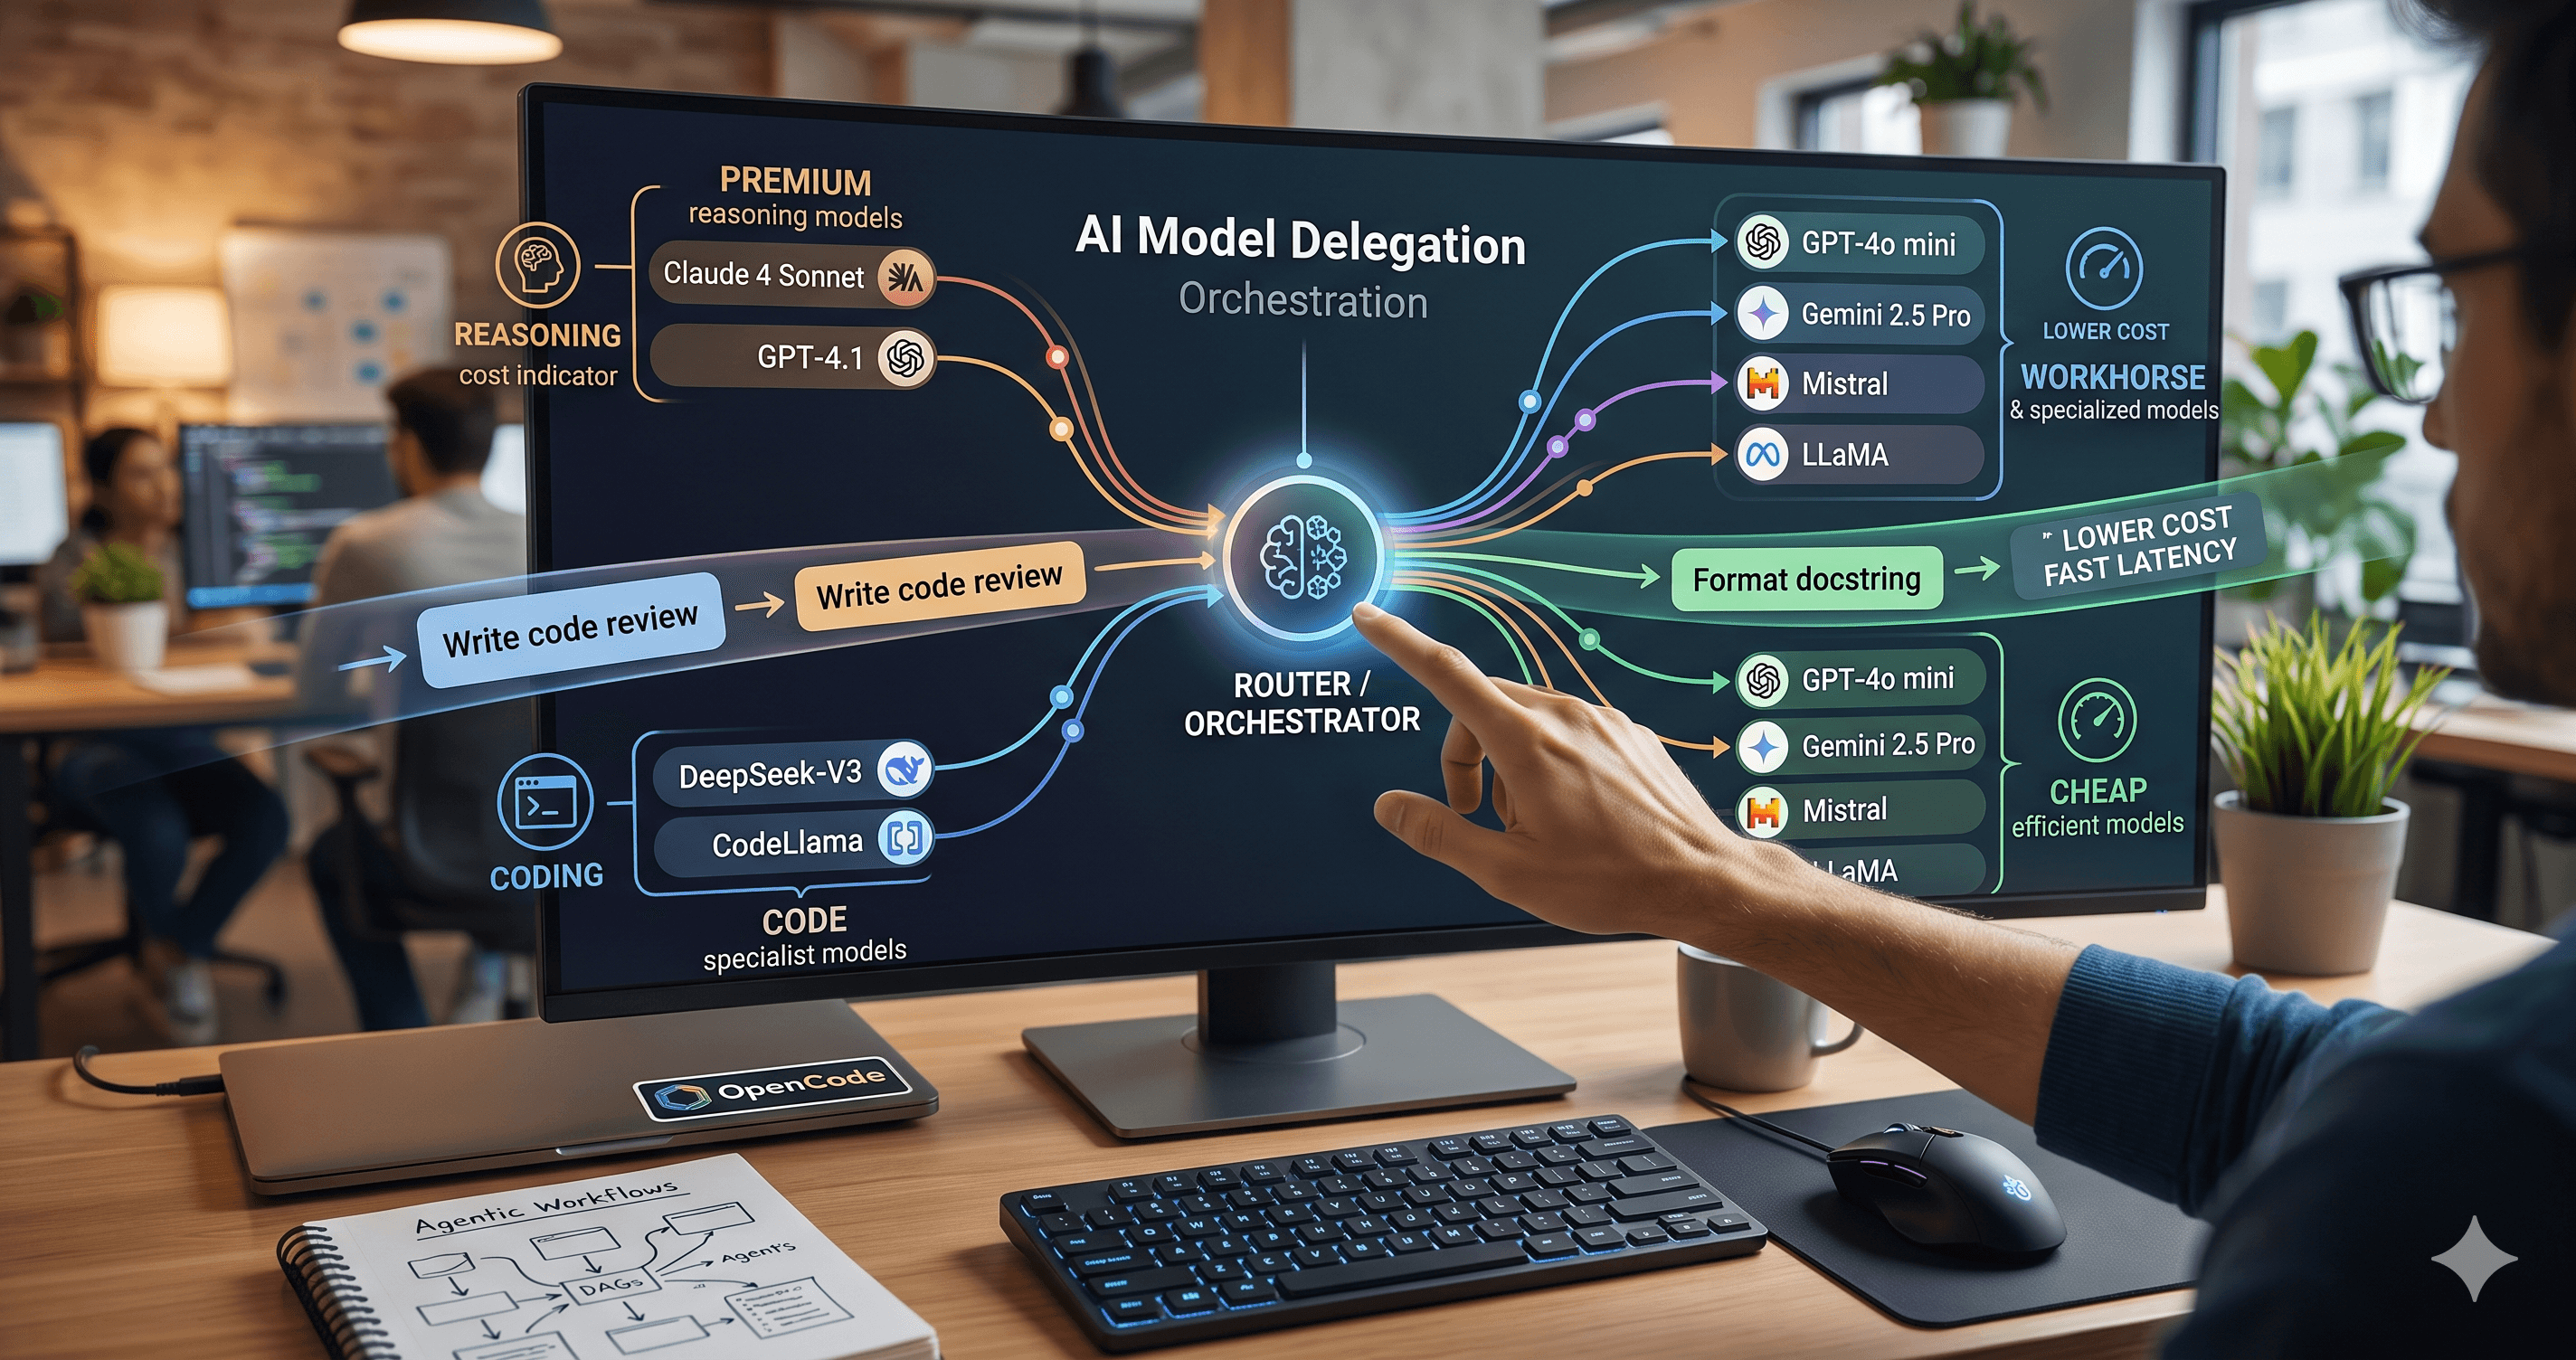
Beyond the single-model myth: Implementing intelligent multi-agent routing and DAG workflows with AI Dispatch.
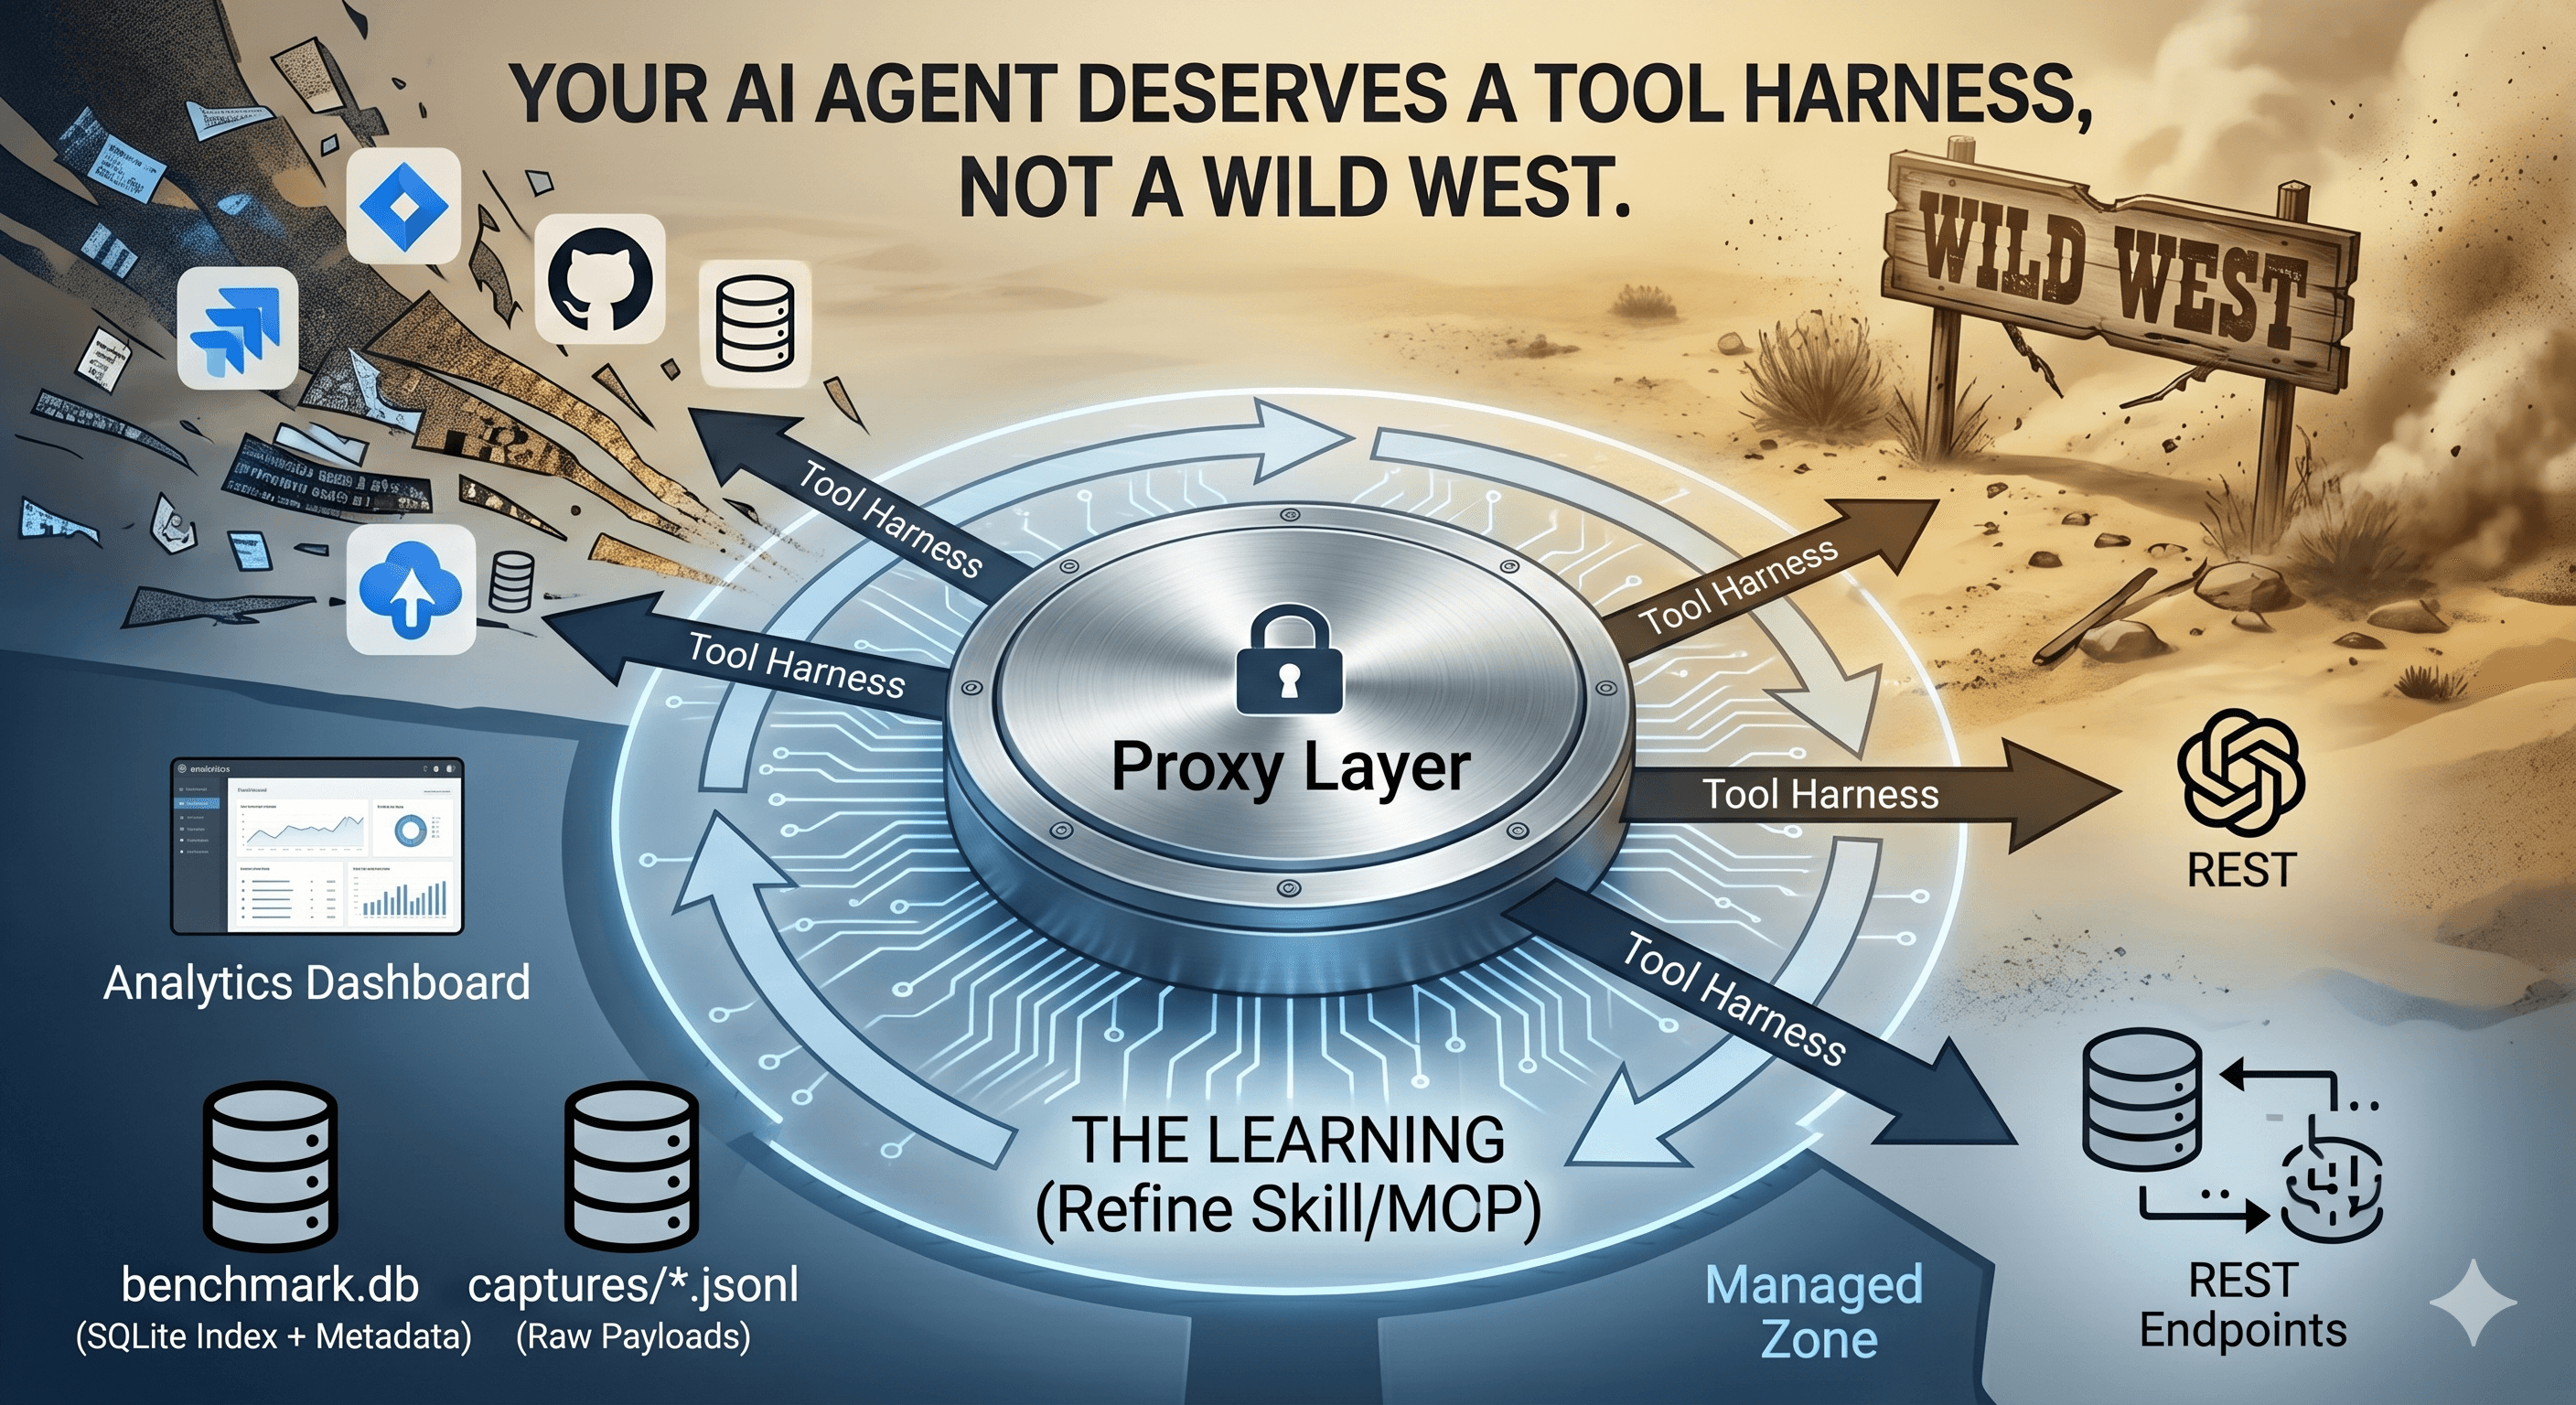
How we built a proxy-driven, benchmark-validated ecosystem for LLMs, and why your company's MCP servers and SKILLS should come with unit tests
I enabled 4 MCP servers and forgot about them. The bill says $515/month.

When you ask GitHub Copilot to write a function, refactor a module, or explain a complex piece of code, the response you get is the output of a probabilistic model. Unlike a traditional deterministic program—where the same input always produces the same output—an LLM (Large Language Model) generates each token based on a probability distribution over its vocabulary. The same prompt can yield different completions across invocations, and the internal reasoning that led to a particular choice of tool or sequence of steps is opaque.
This black‑box nature poses a fundamental challenge for developers who need to trust, debug, or audit Copilot’s behaviour. How do you know which tools the LLM actually invoked? How was the prompt assembled from your context and your question? Did the agent follow the intended chain of thought, or did it take a shortcut that could lead to an incorrect deployment or a security risk?
Observability offers a way to lift the lid on that black box. By capturing structured telemetry—traces, spans, and attributes—we can see exactly what the LLM did: which tools were called, in what order, with what parameters, and how the final response was constructed. This article presents two practical approaches to gaining that visibility: the built‑in debug tools in VS Code and a full‑fledged OpenTelemetry (OTEL) pipeline. Both are accessible to senior developers and can be set up with minimal overhead.
It is tempting to anthropomorphize LLMs and talk about them “thinking” or “reasoning.” In reality, an LLM does not reason in the human sense; it generates token sequences by repeatedly sampling from a probability distribution conditioned on the input prompt and the tokens generated so far. The “thinking” we can observe is not the internal token‑by‑token process (which remains hidden unless we explicitly capture the raw prompt and response text), but rather the high‑level decisions the model makes about which tools to invoke, in what order, and how to assemble context.
For example, when a user asks “Deploy to production,” the LLM might decide to call a bash tool to run a deployment script, then call a read_bash tool to check the output, and finally invoke an enterprise skill that enforces a deployment approval workflow. Each of these steps is a discrete action that can be recorded in a trace. The chain‑of‑thought prompting that sometimes appears in the response (e.g., “First, I will check the current branch…”) is part of the generated text; it is not directly visible as a separate span unless you have enabled content capture and the LLM includes it in the response.
Visible:
Which tools were called, in what order, and with what parameters (e.g., the command string passed to bash).
How the prompt was constructed from the user’s input, the current editor context, and any retrieved files or snippets.
Agent invocations: which agent was used (e.g., workspace, chat, custom_agent) and the operation type.
Timing information: how long each tool call or agent step took.
Not visible:
The internal token‑by‑token generation process (unless content capture is enabled, which records the full prompt and response text).
Why the LLM chose one tool over another—only the outcome is recorded. For instance, you can see that bash was called, but not that it was selected because the LLM “thought” it was the most appropriate tool.
The probability distribution or confidence scores for each token. Those are not exposed in the current Copilot instrumentation.
Understanding these boundaries is critical: observability gives you a detailed log of what happened, but it does not explain the model’s internal reasoning. It is a diagnostic tool, not a mind‑reading device.
VS Code provides a developer debug window that lets you inspect the chat history and see how the LLM processed your prompts and context. To access it:
Open the Command Palette (Ctrl+Shift+P or Cmd+Shift+P).
Run “Developer: Toggle Developer Tools.”
In the Developer Tools panel, switch to the “Console” tab and filter for messages from the Copilot extension.
Look for log entries that show the full chat history, including the system prompt, user messages, and assistant responses.
This view shows the final interactions—what was sent to the model and what came back. It is useful for quick debugging when you want to see exactly what context was included or verify that a particular instruction was followed. However, it has significant limitations:
It only shows the final state, not the real‑time sequence of tool calls or agent steps.
There is no structured trace; you have to parse raw log output.
It does not capture metrics or span relationships.
It works only within VS Code, not for the Copilot desktop app or other editors.
When to use this approach: when you need a fast, no‑dependency check—for example, to confirm that the LLM is seeing the correct file contents or to diagnose why a prompt was misinterpreted. For deeper analysis, you need the full observability pipeline.
The recommended architecture for capturing Copilot telemetry is:
Copilot (VS Code or Desktop App)
    → OTLP Exporter (gRPC or HTTP)
    → OpenTelemetry Collector
    → Aspire Dashboard (or other backend)
Copilot, when configured to export OpenTelemetry data, sends traces and spans to an OTLP endpoint. The OpenTelemetry Collector receives these traces, processes them (batch, filter, enrich), and forwards them to a visualization backend. For local development, the Aspire Dashboard (part of .NET Aspire) provides a simple, self‑contained UI that displays traces, spans, and metrics.
Key environment variables control this pipeline:
COPILOT_OTEL_ENABLED: set to true to enable OpenTelemetry export.
OTEL_EXPORTER_OTLP_ENDPOINT: the URL of the OTLP receiver (e.g., http://localhost:4317 for gRPC, http://localhost:4318 for HTTP).
COPILOT_OTEL_CAPTURE_CONTENT: set to true to include the full prompt and response text in span attributes. Use with caution—this can generate very large traces and may expose sensitive code.
Note: Copilot’s OpenTelemetry integration is currently in preview. Ensure you are using a compatible version of VS Code and the Copilot extension. Preview features may change, have limited support, or require specific versions. For the latest details, see the official GitHub Copilot Telemetry (Preview) documentation.
In VS Code, you configure OpenTelemetry through the settings.json file. Add the following keys under github.copilot.chat.otel.*:
{
  "github.copilot.chat.otel.enabled": true,
  "github.copilot.chat.otel.endpoint": "http://localhost:4317",
  "github.copilot.chat.otel.captureContent": true
}
Replace the endpoint with your collector’s address. If you use HTTP instead of gRPC, change the port to 4318 and ensure the collector is configured accordingly.
These settings take effect immediately; no restart is required. You can verify that traces are being sent by checking the VS Code “Output” panel for the Copilot channel—it will log a message like “OpenTelemetry exporter started.”
The Copilot desktop app (for macOS) does not have a settings UI for OpenTelemetry. Instead, you must set environment variables via a LaunchAgent plist file. This is a macOS‑specific approach; Windows and Linux users should refer to the platform alternatives (see the Practical Considerations section).
Step‑by‑step plist creation:
~/Library/LaunchAgents/com.github.copilot.otel.plist with the following content:<?xml version="1.0" encoding="UTF-8"?>
<!DOCTYPE plist PUBLIC "-//Apple//DTD PLIST 1.0//EN" "http://www.apple.com/DTDs/PropertyList-1.0.dtd">
<plist version="1.0">
<dict>
<key>Label</key>
<string>com.github.copilot.otel</string>
<key>ProgramArguments</key>
<array>
<string>/usr/bin/open</string>
<string>/Applications/GitHub Copilot.app</string>
</array>
<key>EnvironmentVariables</key>
<dict>
<key>COPILOT_OTEL_ENABLED</key>
<string>true</string>
<key>OTEL_EXPORTER_OTLP_ENDPOINT</key>
<string>http://localhost:4317</string>
<key>COPILOT_OTEL_CAPTURE_CONTENT</key>
<string>false</string>
</dict>
<key>RunAtLoad</key>
<true/>
</dict>
</plist>
Load the LaunchAgent:
launchctl load ~/Library/LaunchAgents/com.github.copilot.otel.plist
The environment variables will take effect the next time the app is launched.
Restart the Copilot desktop app (quit and reopen).
To verify that the environment variables are set, you can run launchctl setenv COPILOT_OTEL_ENABLED true (temporary) or check the process environment via ps eww $(pgrep -f "GitHub Copilot").
Note: This method only works on macOS. For Windows, set system‑wide environment variables via “System Properties → Environment Variables” or use a startup script. For Linux, use a systemd service override or a shell wrapper that exports the variables before launching the app.
To collect and visualize traces locally, you need an OpenTelemetry Collector and a dashboard. The simplest setup uses Docker Compose with the OpenTelemetry Collector Contrib distribution and the Aspire Dashboard.
Create a docker-compose.yml file:
version: '3.8'

services:
  otel-collector:
    image: otel/opentelemetry-collector-contrib:latest
    command: ["--config=/etc/otel-collector-config.yaml"]
    volumes:
      - ./otel-collector-config.yaml:/etc/otel-collector-config.yaml
    ports:
      - "4317:4317"   # gRPC
      - "4318:4318"   # HTTP
    depends_on:
      - aspire-dashboard

  aspire-dashboard:
    image: mcr.microsoft.com/dotnet/aspire-dashboard:latest
    ports:
      - "18888:18888"   # Dashboard UI
      - "4319:4319"     # OTLP ingestion (if needed)
    environment:
      - DOTNET_ENVIRONMENT=Development
Now create the collector configuration file otel-collector-config.yaml:
receivers:
  otlp:
    protocols:
      grpc:
        endpoint: "0.0.0.0:4317"
      http:
        endpoint: "0.0.0.0:4318"

processors:
  batch:
    timeout: 1s
    send_batch_size: 1024

connectors:
  spanmetrics:
    dimensions:
      - name: gen_ai.operation.name
        default: unknown
      - name: gen_ai.tool.name
        default: unknown
      - name: github.copilot.tool.parameters.skill_name
        default: unknown

exporters:
  otlp/aspire:
    endpoint: "aspire-dashboard:4319"
    tls:
      insecure: true

  logging:
    loglevel: debug

service:
  pipelines:
    traces:
      receivers: [otlp]
      processors: [batch]
      exporters: [otlp/aspire, logging]
    metrics:
      receivers: [spanmetrics]
      exporters: [logging]
Key dimensions for LLM observability:
gen_ai.operation.name: identifies the type of LLM operation (e.g., chat, completion, agent).
gen_ai.tool.name: the name of the tool called (e.g., bash, read_bash, mcp_tool).
github.copilot.tool.parameters.skill_name: for enterprise skills, the name of the skill invoked.
The spanmetrics connector generates metrics from trace data, allowing you to track tool usage frequency and operation types over time.
Run docker compose up in the directory containing the docker-compose.yml file.
Wait for the collector and dashboard to start (check logs for “Everything is ready”).
Open the Aspire Dashboard at http://localhost:18888.
In VS Code or the Copilot desktop app (with OTEL enabled), start a chat or use Copilot features. You should see traces appearing in the dashboard within a few seconds.
The dashboard will show a list of traces. Clicking on a trace reveals a waterfall view of spans, each with its attributes. For example, a chat session might have a root span “chat session” with child spans for each tool call. The span attributes will include the parameters passed to the tool, the duration, and (if content capture is enabled) the full prompt and response text.

A typical Copilot trace contains the following span hierarchy:
Root span: represents a chat session or a single user interaction. Attributes include gen_ai.operation.name (e.g., chat), user.id (if available), and session.id.
Child spans: each tool call or agent invocation gets its own span. For example:
tool.call span with gen_ai.tool.name = bash and attributes like gen_ai.tool.parameters.command.
tool.call span for read_bash with the output file path.
agent.invoke span with gen_ai.operation.name = agent and github.copilot.tool.parameters.skill_name = deploy_approval.
MCP tool calls: if Copilot uses the Model Context Protocol (MCP), a span with gen_ai.tool.name = mcp_tool and additional attributes like mcp.tool.server and mcp.tool.name.
Note: The exact attribute names (e.g.,
gen_ai.tool.parameters.command) may vary slightly depending on the Copilot version and instrumentation. For the most up‑to‑date schema, consult the official GitHub Copilot Telemetry (Preview) documentation.
By reading the sequence of spans in a trace, you can reconstruct the LLM’s decision path. Consider this example:
User asks: “Deploy to production.”
Root span: chat session.
Child span: tool.call → bash with command git status.
Child span: tool.call → read_bash with output “On branch main, clean working tree.”
Child span: tool.call → bash with command ./deploy.sh.
Child span: agent.invoke → enterprise skill deploy_approval with parameters {environment: "production"}.
From this trace, you can see that the LLM first checked the current branch, then decided to run a deploy script, and finally invoked an approval skill. The span attributes tell you the exact commands and parameters used. If content capture is enabled, you can also see the prompt that led to each tool call and the response that generated the next step.
This flow is not a record of the model’s internal “thoughts” but a precise log of the actions it took. It is invaluable for debugging unexpected behaviour, such as when the LLM calls a tool you did not intend or skips a critical validation step.
The spanmetrics connector in the collector produces metrics from the trace data. These metrics can be exported to Prometheus, Grafana, or simply logged. Common metrics include:
Tool call count by gen_ai.tool.name: how often each tool was used.
Operation type distribution by gen_ai.operation.name: proportion of chat vs. agent vs. completion spans.
Skill invocation frequency by github.copilot.tool.parameters.skill_name: which enterprise skills are most used.
Duration percentiles for tool calls and chat sessions.
These aggregated metrics help you understand usage patterns and identify performance bottlenecks or unexpected tool usage across your team.
Enabling OpenTelemetry export adds minimal overhead when content capture is off—the exporter batches spans and sends them asynchronously. However, enabling COPILOT_OTEL_CAPTURE_CONTENT can generate very large traces (prompts and responses can be thousands of tokens). This can increase memory usage in the collector and network bandwidth.
Recommendation: Enable content capture only during targeted debugging sessions, not continuously. Use the batch processor in the collector to reduce the number of outgoing requests. For production use, consider sampling traces (e.g., keep 1% of traces) to reduce volume.
The default collector configuration exposes ports 4317 and 4318 to the host. In a local development environment this is usually acceptable, but if you run the collector on a shared or production machine, you should:
Restrict network access (e.g., bind to 127.0.0.1 instead of 0.0.0.0).
Add TLS encryption and an API key for the OTLP receiver.
Use authentication middleware in the collector.
Content capture includes potentially sensitive code, secrets, or proprietary information. Be mindful of data retention policies—consider setting a TTL on the collector’s memory or using a database that supports automatic deletion. Never leave content capture enabled in a shared environment without auditing what is being recorded.
VS Code configuration works identically on Windows, macOS, and Linux via settings.json.
Copilot desktop app: the LaunchAgent approach is macOS‑only. On Windows, set environment variables via System Properties → Environment Variables (system‑wide) or use a batch script that launches the app with set COPILOT_OTEL_ENABLED=true. On Linux, use a systemd service override with Environment= directives, or a shell wrapper that exports the variables before running the app.
Collector and dashboard: Docker Compose works on all platforms, but you may need to adjust network settings (e.g., on Windows, use host.docker.internal instead of localhost for the OTLP endpoint).
The Aspire Dashboard is convenient for local development, but you can replace it with any OpenTelemetry‑compatible backend:
Jaeger: a classic distributed tracing tool with powerful query capabilities and service dependency graphs. Use the Jaeger exporter in the collector.
Zipkin: similar to Jaeger, with a simpler UI.
Grafana Tempo: a scalable, cost‑efficient trace storage backend that integrates with Grafana for dashboards.
Trade‑offs: Aspire offers the simplest setup (single Docker image), while Jaeger and Tempo provide richer querying and aggregation features, especially for large trace volumes. For a team setting, consider using Grafana Tempo with the Grafana stack for unified metrics, logs, and traces.
To debug a specific user interaction, you need to map the trace to the chat session. The Copilot instrumentation typically includes a session_id or trace_id in the root span’s attributes. You can search for this ID in the dashboard or export traces to a log aggregation system. If your collector is configured to log span data, you can grep for the session ID in the collector’s output.
For deeper correlation, consider adding a custom attribute (e.g., user.id or chat.id) via the Copilot API if you are building a custom extension.
If you have built custom agents or MCP servers that interact with Copilot, you can instrument them with OpenTelemetry to get end‑to‑end traces. For example:
Add span attributes to your MCP server’s tool handlers using the OpenTelemetry SDK for your language (Python, Node.js, Go, etc.).
Propagate the trace context from Copilot’s OTLP export to your server via the traceparent header (if using HTTP) or the gRPC metadata.
Ensure that spans from your custom agent appear as child spans under the Copilot chat session root span.
This allows you to see the full journey: from the user’s question, through Copilot’s tool selection, to your custom logic and back.
When to use VS Code built‑in debug tools:
Quick, one‑off debugging of a single chat interaction.
No external dependencies—works out of the box.
Limited to seeing final prompt/response, not tool call sequences.
When to use the full OTEL setup:
You need to understand the sequence of tool calls and agent invocations.
You want to aggregate metrics across multiple sessions or users.
You are debugging complex interactions involving enterprise skills or MCP tools.
You are building custom agents and need end‑to‑end trace correlation.
Quick start guide for VS Code users:
Add the three github.copilot.chat.otel.* settings to your settings.json.
Run the Docker Compose setup from the Local Collector Setup section.
Start using Copilot—traces appear in Aspire Dashboard at http://localhost:18888.
Full setup for teams:
Deploy the OpenTelemetry Collector as a shared service (e.g., in a Kubernetes cluster or on a VM).
Use a scalable backend like Grafana Tempo or Jaeger.
Enable content capture only on demand, and implement retention policies.
Instrument custom agents and MCP servers for unified observability.
Next steps:
Experiment with content capture to see the full prompt/response in traces.
Build metric dashboards in Grafana using the spanmetrics dimensions.
Extend the setup to cover your own tools and agents.
By lifting the lid on Copilot’s black box, you gain the confidence to trust its outputs, diagnose failures, and optimise your AI‑assisted development workflow.
OpenTelemetry Documentation — used for collector configuration and OTLP protocol details.
GitHub Copilot Telemetry (Preview) — official documentation for Copilot’s OpenTelemetry export (environment variables and settings).
.NET Aspire Dashboard — used for local trace visualization.
OpenTelemetry Collector Contrib — reference for the spanmetrics connector and batch processor.
VS Code Developer Tools — used for accessing the debug console.